Chicago census 2020: an extremely mixed bag

For just the second time in the last 70 years, the City of Chicago posted population growth from one decennial census to the next, adding a little over 50,000 people.
Of course, in such a large City, growth is never going to be even. No matter how you slice it, be it age, race, geography or any other metric, patterns will emerge. After ten days of digging through the data, here are my top takeaways:
Chicago has one of the fastest growing downtowns in America
This won’t be news to most, but downtown Chicago is one of the fastest growing downtowns in America over the last 30 years.

Since 1990, the population of the Loop and its 3 adjacent community areas has nearly doubled, and the last decade saw the largest growth yet, both in raw and percentage terms. Near North Side added 25k residents and passed Lakeview to become the most populous community area. The Loop, Near North and Near South all posted their highest population ever, something that is true of few, if any, other community areas.
Lakefront neighborhoods see solid growth
Downtown’s explosive growth is merely a slight acceleration of trends from the 2000’s. What’s much different from the 2000’s is that almost all core lakefront areas — both north and south — saw growth, often higher than the nationwide growth rate.

Other than Edgewater, every community area bounded by Lake Michigan, the North Branch of the Chicago River, I-90, and 79th street gained population. And many did so by more than the nationwide growth rate of 7.4%.
Growing households on the Northern Lakefront; More households on the Southern Lakefront
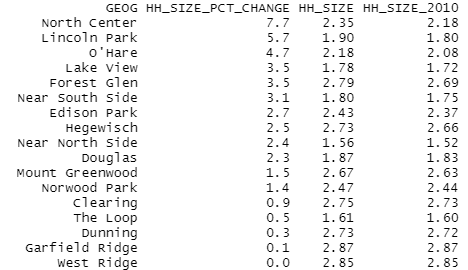
There are differences in how different lakefront areas achieved growth. The three fastest-growing areas on the northern lakefront (North Center, Lincoln Park and Lakeview) saw only a modest increase in their number of households. However, those three were some of the only areas in the entire city to post a non-trivial increase in average household size, albeit from a low baseline. In other words, yuppie-heavy areas that have long had low child population shares are finally starting to see more children. As a result, you can see them stand out at the top of this chart:

Conversely, southern lakefront areas generally saw a decrease in household size, and grew mostly via adding new households.

I suspect I may start to see increasing concern on Twitter about gentrification on the southern lakefront, but it’s worth noting that this growth came overwhelmingly from adding non-white residents. An increase in Black residents accounted for a majority of overall population growth in Oakland, Grand Boulevard and Washington Park, and only Woodlawn saw a decrease in absolute number of Black residents.
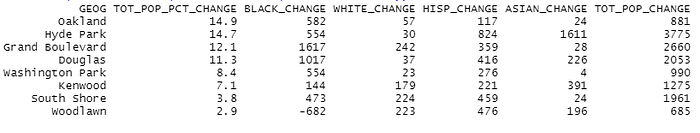
In total, these 8 areas added about 4.3k Black residents, 3.1k Hispanic residents, 2.5k Asian residents, and 1k white residents, plus 3.4k identifying as another race or multiple races.
Gentrification often means a net population loss
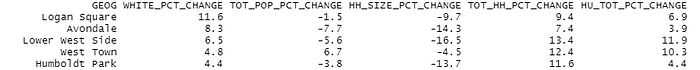
When I posted my initial estimates of population by community area, the most common comment I got was surprise that Logan Square lost population. This was a pattern: the most rapidly gentrifying areas generally lost population. The reason is straightforward: sharply declining household sizes, with childless professionals displacing families.
Here’s a list of community areas that saw the largest increase in white population share. All but one saw a decline in total population, in spite of an increase in total households, due to a decline in household size. Also note that the vacancy rate decreased in each instance, with the increase in households outpacing the increase in housing units.
Hispanic population rises while Black population plummets
Perhaps the most striking Chicago statistic from the 2020 census, albeit not a surprising one if you’ve been following the city’s demography over the past 20 years, is a decline of nearly 85k Black residents. Conversely, the Hispanic population increased by over 40k residents, and surpassed the Black population for the first time.
While these shifts have been well documented, one thing I didn’t realize is the extent to which they have occured in the exact same community areas simultaneously. Across much of the West and inland South Sides, the Hispanic population has risen quickly, but the Black population has fallen faster, usually creating a net population loss.
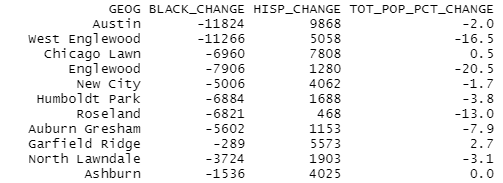
Across these 11 community areas, the Black population declined by a combined 68k, while the Hispanic population rose by 43k, enough to account for most of the citywide shift in both demographics.
Multiracial identification rises fastest in white neighborhoods
The share of Chicago’s population not identfying as white alone, Black alone, Asian alone or Hispanic nearly doubled, from 1.7% in 2010 to 3.1% in 2020. Every community area saw an increase in this category, both in raw count and percentage. But there’s a clear pattern to which community areas saw the largest increase: the top 14 are all plurality-white.

This leads me to believe that much of this shift, though certainly not all of it, stems from people shifting from “white alone” identification to a multi-racial identification.
Chicago’s child population is collapsing at a startling rate
One common claim I’ve seen on Twitter is that cities are increasingly for the childless. I think that up until recently, this claim was mostly false, with a handful of exceptions like Seattle and San Francisco. But there’s no doubt that it has become increasingly true over the last decade in Chicago.
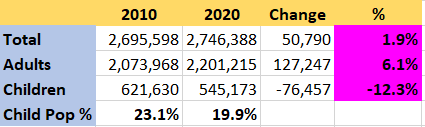
From 2010 to 2020, Chicago’s adult population increased by 6%, while the child population fell by a stunning 12%:
While I don’t have data on the exact geography of which areas lost the most children, I do have household size data, which is highly correlated, and shows the vast majority of community areas posting shrinking household sizes:
Only 17 out of 77 community areas posted an increase in household size. Most of them are plurality-white:
In 2010, the average household size in Chicago was 2.52, not far off the nationwide average of 2.59. While the nationwide household size fell to 2.53 in 2020, Chicago’s household size fell much more sharply to 2.36, more than doubling the gap between Chicago and the nation on this metric.
As you’d expect from the geography of household size changes, the decline in Chicago’s child population is concentrated in Black and Hispanic children. The number of white children held steady, and the number of Asian children increased:
I will caution that the numbers in the above table don’t align *exactly* to how I’ve been defining race in the rest of this article. In the rest of the article, I use a mutually-exclusive {White, Black, Hispanic, Asian, Other} partition from CMAP. Conversely, the above data is from Dave’s Redistricting App, which double-counts if someone identifies as Hispanic and Black, Hispanic and Asian, or Black and Asian. However, the overall picture should be qualitatively accurate.
Chicago is far from the only place to see a decrease in its under-18 population: 5 of the 6 largest cities did, even fast-growing Phoenix. And the nation as a whole saw a 1.4% decrease in child population. But Chicago’s decline is much steeper the national average. Among the six largest cities, only LA saw a steeper decline.
To put it in perspective: the combined decline in under-18 population in Los Angeles and Chicago (-199,490) is enough to account for 18.5% of the nationwide decrease in under-18 population (-1,075,467). But only 2% of the US lives in Los Angeles or Chicago.
What we still don’t know
There’s still plenty of information that either hasn’t been released yet by the Census Bureau, or that I just haven’t seen. For one, there’s income. While it’s likely that Chicago became wealthier over the last 10 years, it hasn’t been quantified in terms of median income or poverty rate. And I don’t have any data on changes to the age distribution outside of the binary adult-vs-child dichotomy. Finally, I haven’t seen any data on educational attainment. I assume this information is not in the redistricting data, and will come in a later release.
